Dashboard is a great communication tool especially for snap presentations. In situations where allotted time for presentation is limited, a well designed Dashboard that can communicate at-a-glance all the important KPIs is your trump card! Below is a common scenario that confronts executives in the corporate world.
Jill is the Singapore procurement manager of NanoTools Inc., a leading US MNC that designs & builds high tech semicon equipment. NanoTools (SG) is the field sales & service hub for Asia. In view of the challenging economic times, Jill has been tasked by HQ to drive down cost. One cost reduction area that Jill’s team has been targeting is air travel expenditure. Their concerted efforts have paid off, saving the company over $1 m in air travel expenditure in 2015. Jill’s next important task is to present the excellent results at the Senior Exec meeting in San Jose, CA. If the meeting goes well, Jill’s team can look forward to an additional 3-month bonus. The stakes are high!
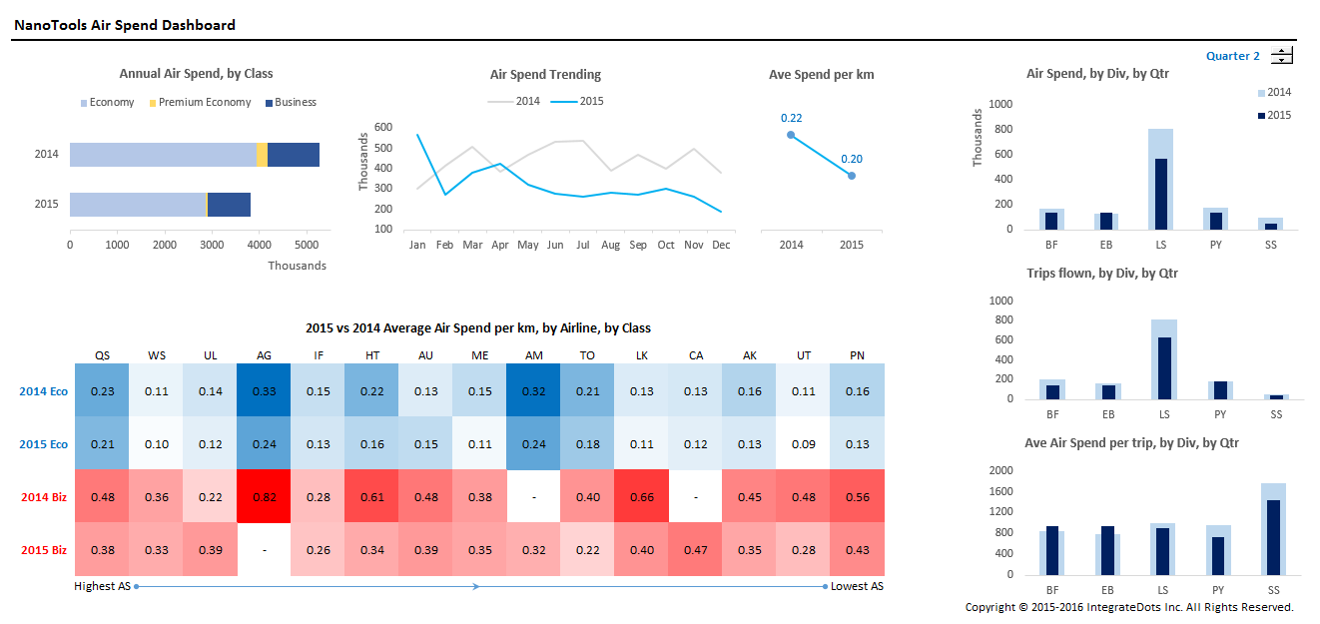
Desired Key Performance Indicators (KPIs):
- 2015 vs 2014 air spend, by travel class
- 2015 vs 2014 air spend monthly trending
- 2015 vs 2014 average air spend per km
- 2015 vs 2014 air spend by 5 business divisions, by quarter
- 2015 vs 2014 number of trips, by division, by quarter
- 2015 vs 2014 air spend per trip, by division, by quarter
- 2015 vs 2014 air spend per km, by airline, by travel class
Design and implement a Dashboard using Microsoft Excel. Dashboard needs to provide at-a-glance view into all the KPIs so that Jill can communicate clearly her team’s excellent results at the Senior Exec meeting.
Here’s the completed Dashboard:-


For a synopsis of the workshop, read “Automating Reports with Dashboards”.
We can also customize the equipping talk and workshop to suit your organization’s needs and deliver the session on-site.
If you need more information or get a quote for these equipping courses, please contact us. Alternatively, email us directly at info@integratedots.com.
We look forward to hearing from you!
