Participants on last Saturday’s workshop “Automating Reports with Dashboards” was an enthusiastic bunch. The workshop was kept at high gear and spirits! Participants hailed from many different industries including Oil & Gas, Medical, Telecom. They raised many good questions and took to the hands-on exercises with gusto!
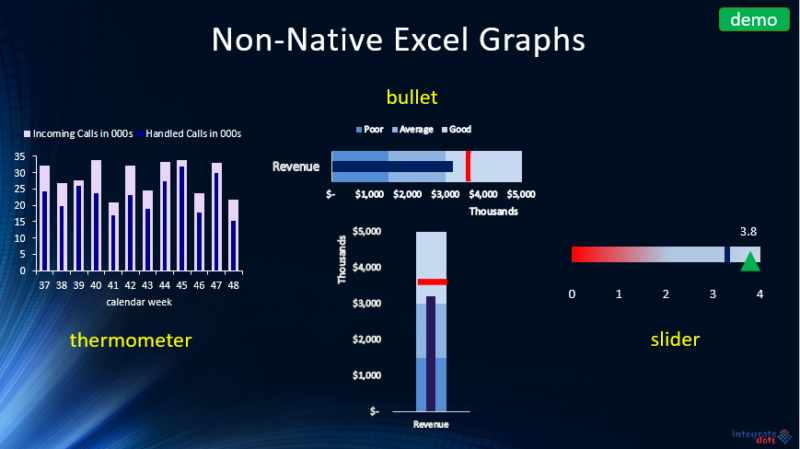
The workshop session covered many areas. We wanted to deliver more value, over and beyond the customer’s expectation. Topics covered included the Excel Application Development Blueprint, Dynamic & Pivot Tables, Effective Dashboard design and even taking a peek at VBA/macro. Along the way, the participants also learnt to construct non-Excel graphs such as the Thermometer and Bullet graphs. Indeed, lots of stuff to pick up!

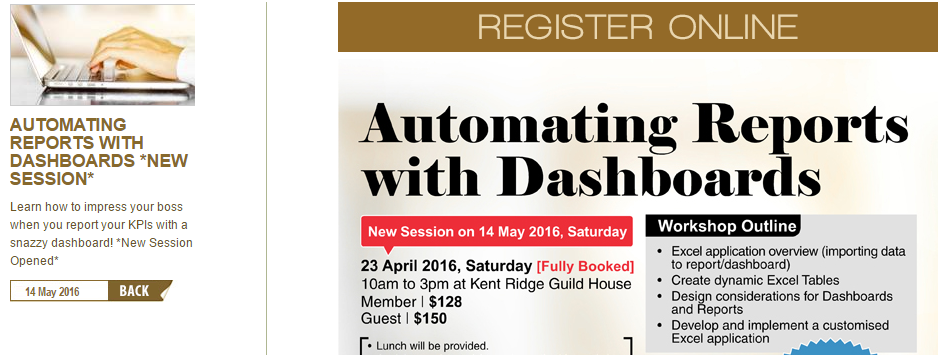
Last Saturday’s workshop was oversubscribed. In order to meet market demand, we have increased the intake for the next workshop. If you are keen to attend the workshop, please register early to avoid disappointment. For more details regarding the workshop, please visit the NUSS page.

For registration and further information, please contact Kelly Koh at 6586 3741 or email kellykoh@nuss.org.sg.
There will also be another run of “Essential Communications with Dashboards” talk on 21 July 2016 (Thursday).
