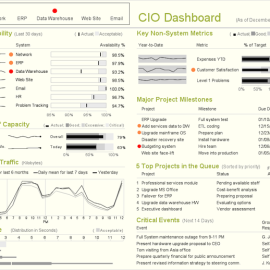
We define a dashboard as – “A visual communication tool to provide at-a-glance view into key performance indicators which are essential in achieving an objective.” A dashboard is typically presented on a single screen or a single page in a report. Dashboards, especially
Tell your story with a Dashboard!
Critical Thinking & Creativity in the 21st Century

The 21st century economy requires new mind-sets, different knowledge and skills. Unfortunately, traditional schools, where didactic teaching is still prevalent, fall terribly short of what’s required in this new dynamic, fast paced and increasingly interconnected global economy. This post from World


