Dashboards are employed in the corporate world to monitor Key Performance Indicators (KPIs) in order to achieve certain objectives or improve business processes. We are all too familiar with these two maxims commonly adopted in the industry: “what gets measured, gets done” and “if you can’t measure it, you can’t control it”. Very true, indeed!
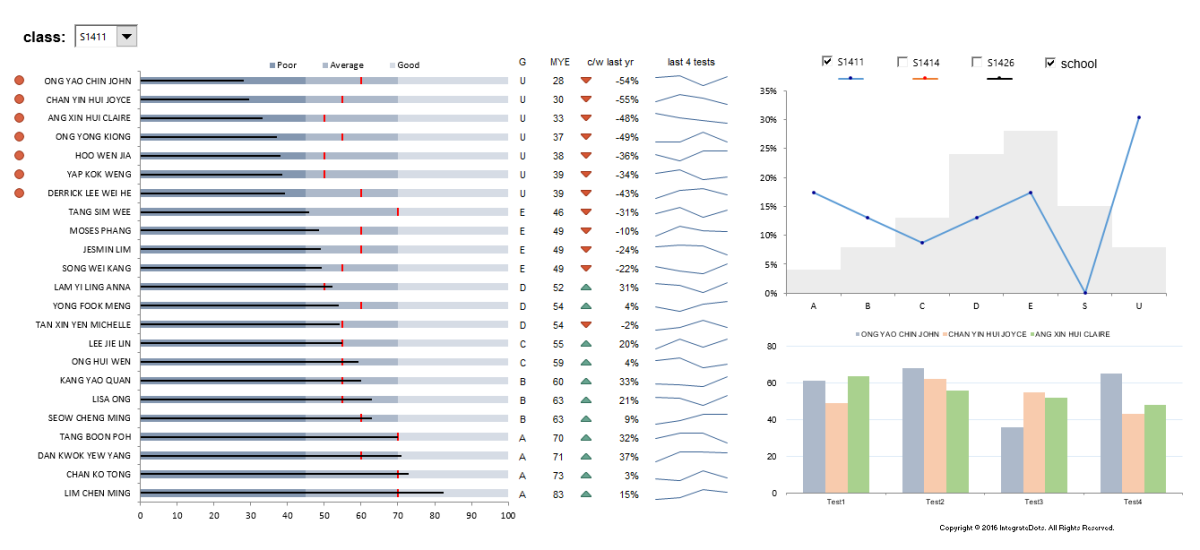
These two maxims apply equally well in a school setting. Imagine John, a JC Physics teacher, has 3 JC year 2 classes comprising students with varying degree of competencies in Physics. John’s school, like many others, still uses a simple and crude Excel worksheet to track the entire cohort’s performance in the subject. As expected, the workbook is error prone and becomes increasingly unwieldy over time. John wants to have a tool to keep track of his students’ progress. John needs KPIs to help him track his individual student’s performance against set targets, performance trending, bench-marking class against cohort … etc. This sounds like the perfect job for a Dashboard!
Here’s a Dashboard that John would love to have:

IntegrateDots holds regular talks and workshops at Kent Ridge Guild House@NUSS to share insights and techniques on how to use Dashboards to communicate-at-a-glance. Look out for announcements on upcoming talks and workshops in our blogs.
For a synopsis of the talk and workshop, read “Essential Communications with Dashboards” and “Automating Reports with Dashboards”.
We can also customize the talk or workshop to suit your organization’s needs and deliver the session on-site. If you need more information or get a quotation for these equipping courses, please contact us. Alternatively, email us directly at info@integratedots.com.
We look forward to hearing from you!
