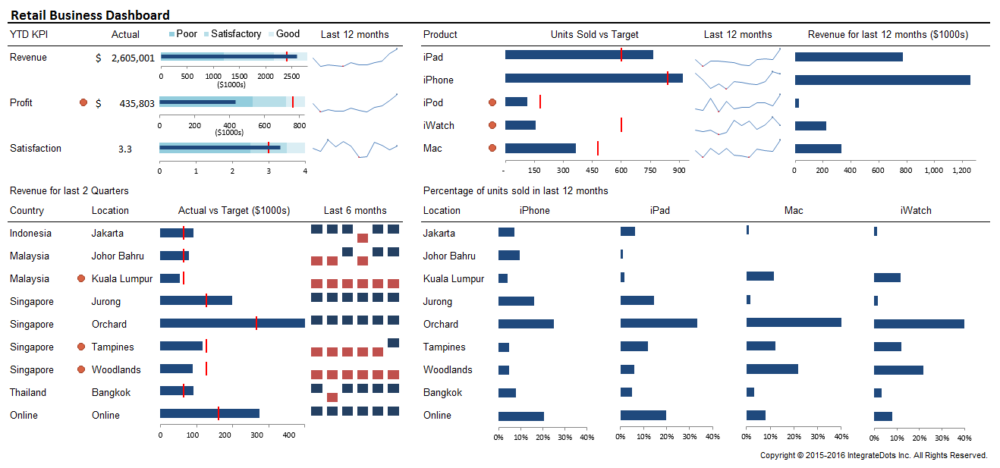
Imagine we have been approached by a business owner of iGadgets.com to design a Dashboard. iGadgets sells the latest Apple products in 8 retail shops as well as online. 4 shops are located in Singapore (Orchard, Woodlands, Jurong and Tampines), 2 in Malaysia (Kuala Lumpur and Johor Bahru), 1 each in Indonesia (Jakarta) and Thailand (Bangkok).
The owner wants a simple and effective Dashboard to monitor business profitability and operations performance. Hopefully, with these information conveyed by the Dashboard the owner could gain some insights on how he could improve the top and bottom line.
iGadgets can provide us with all the raw data (sales transactions and targets) in an Excel file. The owner wants to keep costs down and does not wish to invest in sophisticated and expensive software to build the Dashboard.
To meet the owner’s objectives, we have designed the Dashboard to have
- Year-to-Date (YTD) Key Performance Indicators (KPIs); Revenue, Profitability and Customer Satisfaction
- For each KPI, show actual YTD / average, how it measures up against a target, and against qualitative performance bands (poor, satisfactory, good).
- For each KPI includes 12 months trending
- For each shop location, monitor the 6-month revenue vs target and include a month to month win/loss trending
- Unit Sold vs Targets and 12 month trending by product type
- Part-to-whole percentage of sales by product type and location
- Flag alerts when targets are not met
Here’s the completed iGadgets Dashboard.

From the Dashboard above, the owner could gain valuable insights into the business.
To find out more about Dashboard, sign up for our talk on “Essential Communications with Dashboards” at NUSS Kent Ridge Guild House on 17 March 2016 (Thursday) 7 pm to 9 pm. For more details, check this post.
