Jeb is excited about his research findings. After spending a grueling 6-month in the field talking to different stakeholders and sieving through tons of passenger traffic data on the Mass Rapid Transit, he has found the key to achieve a quantum leap in the reliability of the public rail system. The solution is so simple and cost-effective! He is looking forward to presenting his research findings and solution at the upcoming Urban Transportation annual conference in Geneva.
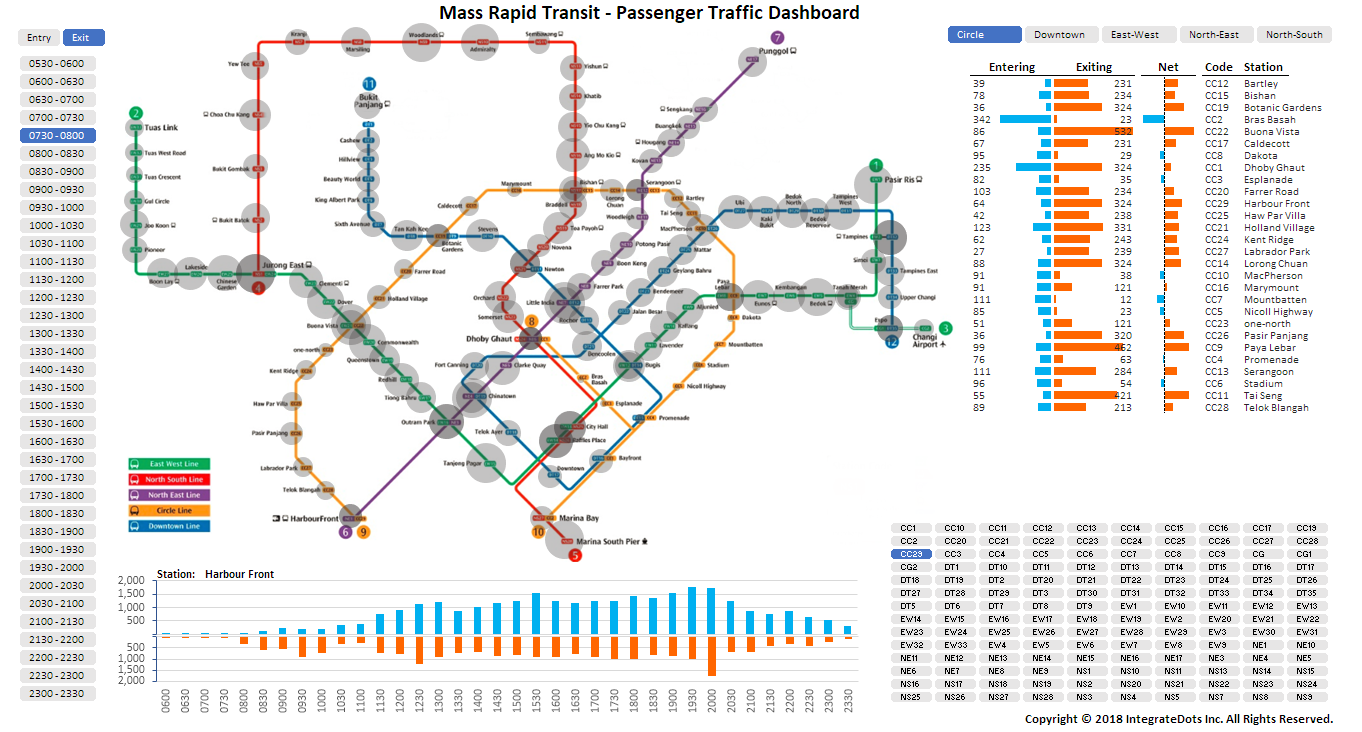
As part of his presentation, he wants an interactive Dashboard to showcase the current Passenger Traffic Flow in and out of all the MRT stations throughout the day. The Dashboard needs to show the following:
- a bird’s eye view of the whole MRT system map and stations
- passenger traffic flow in and out of all MRT stations on the map
- option to display passenger traffic flow at different time slots across the entire system
- option to display passenger loading at a particular MRT station (out of 140 stations) throughout the day
- option to display the passenger flow at all stations on a particular MRT line (out of 5 lines)
Being a poorly funded postgraduate research student, Jeb cannot afford to buy expensive tools to design and build this Dashboard. Well, he is in luck. There is a great tool on his laptop that could do this job perfectly – Mircosoft Excel!
With some tricks and cool techniques in Excel, coupled with a dose of creativity, Jeb has built a snazzy Dashboard (see below) for his presentation.
Here’s the shocker – this dynamic and interactive Dashboard has been built without having to write a single line of VBA code. Yup, you heard it right! Anyone, including a non-techie, can learn to build awesome Dashboards!
If you’d like to learn how to build cool Dashboards using Excel, please consider our upcoming Building Impactful Dashboards workshop on 23 June 2018 at the NTU Alumni House @ Marina Square.
If you are an NTU Alumnus, you can enjoy a further 10% discount. Look out for the coupon code on the NTU Alumni facebook.
Besides the Dashboard workshop, we are also conducting Coding in VBA and Coding in Python workshops in June and July respectively at the NTU Alumni House. Come join us for some coding fun!