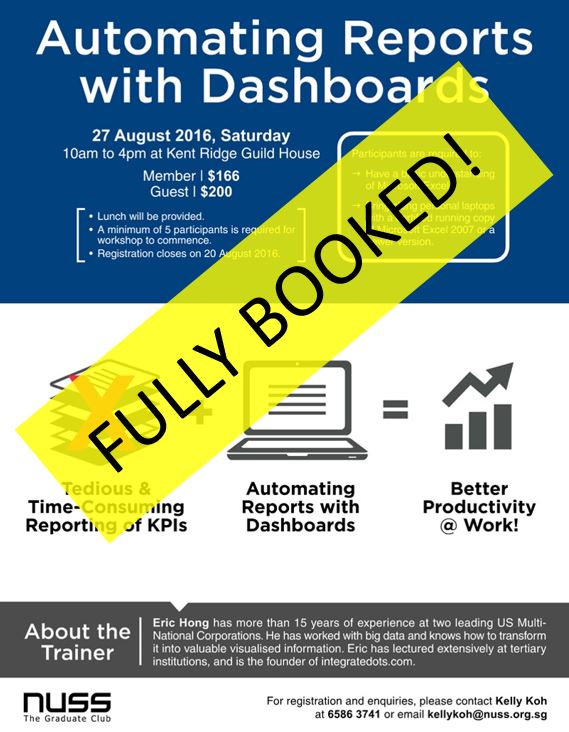
For those who have missed the previous “Automating Reports with Dashboards” workshop sessions, here’s the good news. The next run of the workshop is on 27 August 2016 (Saturday), Kent Ridge Guild House@NUSS. What’s more is that we have decided to extend the new workshop session by 1 hour based on past participants’ feedback for longer hands-on practice.

Back by popular demand. The new workshop will be extended by 1 hour. Places are limited. Sign up early to avoid disappointment!
Workshop Objective:
To equip participants with essential knowledge, skills, tips and techniques to build a customized Excel application that makes report or dashboard generation a breeze.
Target Audience:
Professionals who work with data report, analysis or visualization (e.g. data analysts, engineers, marketeers, managers)
Hear what our participants say about the workshop:
“The workshop is value for money. It is highly informative and a useful must learn skill.” – Grace Seow HR Comp & Ben, Uber
“Straight to the point. Discuss things that has immediate impact in my work (eg Presentation, make complex data easier to present to top management). Glad I signed up for the workshop!” – Aldwin Chua Quality Assurance, REC Solar
“Ideas and tips for new ways to plot graphs.” – Allen Chow Corporate Services, NTU
“Simple steps to follow. Very good to know!” – Jack Tan Marketing, ExxonMobil
“Various interesting features to analyze data!” – P.H. Low IT, Faxolif Industries
“Very practical. Keep it up! It is a very useful programme.” – Alison
