We define a dashboard as –
“A visual communication tool to provide at-a-glance view into key performance indicators which are essential in achieving an objective.”
A dashboard is typically presented on a single screen or a single page in a report. Dashboards, especially the interactive type, are being hosted on web portals as well.
Here are examples of well designed Dashboards.
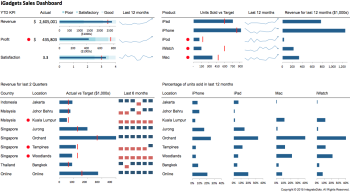
Image Source: IntegrateDots.com
Image Source: exceluser.com
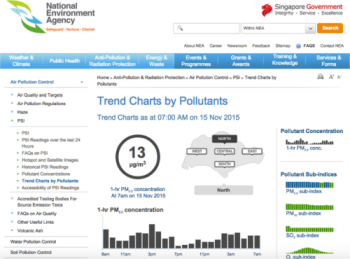
Image Source: NEA, Singapore
A dashboard is usually confined to display information on one screen or one page. And, the pertinent information needs to be communicated visually in a fast and accurate manner. A well designed dashboard needs to take into account all these constraints and requirements.
We’d discuss some key design considerations for a dashboard in a subsequent post.